
Sources: Airbnb and STR Management data, as reported in Q2 2024.
Austin’s Vacation Rental Market: Understanding Trends and Navigating Change
As we navigate through 2024, we’re observing notable shifts in Austin’s vacation rental market. Oversupply and economic softening have contributed to a noticeable performance gap compared to last year. Factors such as last year’s exceptionally hot summer have also influenced this year’s trends.
However, there’s plenty of good news! Despite these challenges, we are exceptionally outperforming the Austin market. Our strategic approach and commitment to excellence are paying off, as highlighted below.
While we anticipate a slower summer season, there are positive signs on the horizon. We expect to see improved performance as we move into late fall, aligning with broader trends observed across the U.S. vacation rental industry. We remain committed to navigating these dynamics with you, ensuring your property continues to thrive in this evolving landscape.
Austin’s current AirDNA Market Score is 54: rental demand 39, revenue growth 58, seasonality 81, regulation 46, and investability 31. (How is Market Score calculated?)
STR Management Outshines the Market on Airbnb
More Views and Higher Conversions
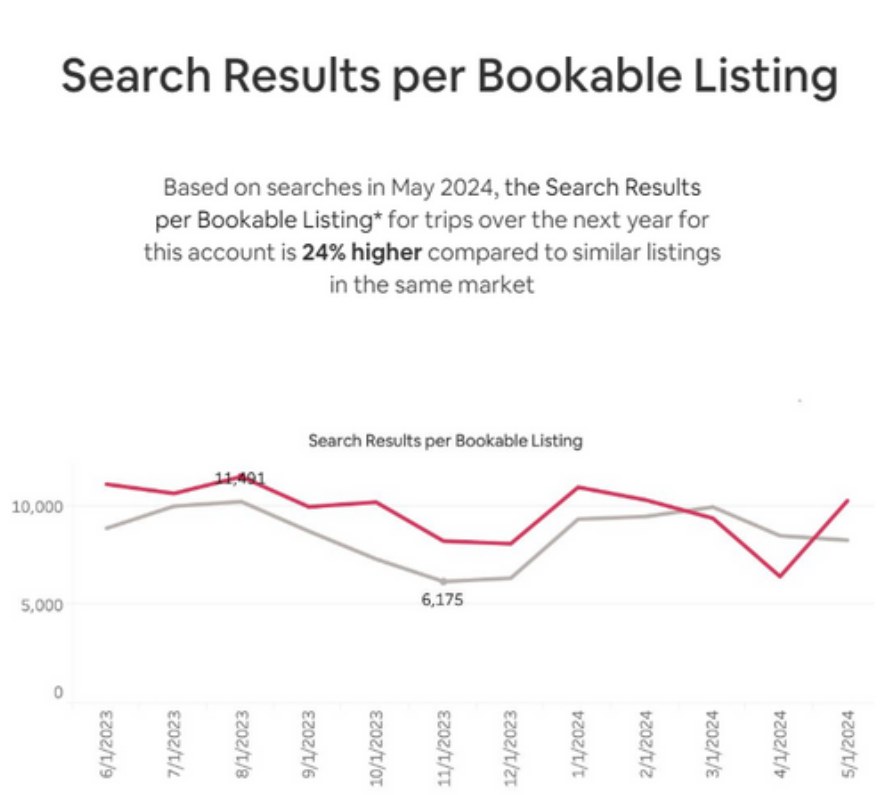
Our latest Airbnb data from June 2023 to May 2024 shows our listings consistently outperform the market. Despite the dip below the market in April 2024, which we attribute to our increased pricing in correct anticipation that the market was underpricing the impact of the total solar eclipse, we maintained a solid lead, achieving search results that are 24% higher than similar listings in the same market.
Additionally, our listings have outperformed the market in terms of conversion rates, achieving a listing page to bookings conversion rate (CVR) that is 14% higher than similar listings. This indicates that a greater percentage of page views are turning into bookings, underscoring the effectiveness of our strategies. Our conversion rate continues to maintain a significant margin above the market average.
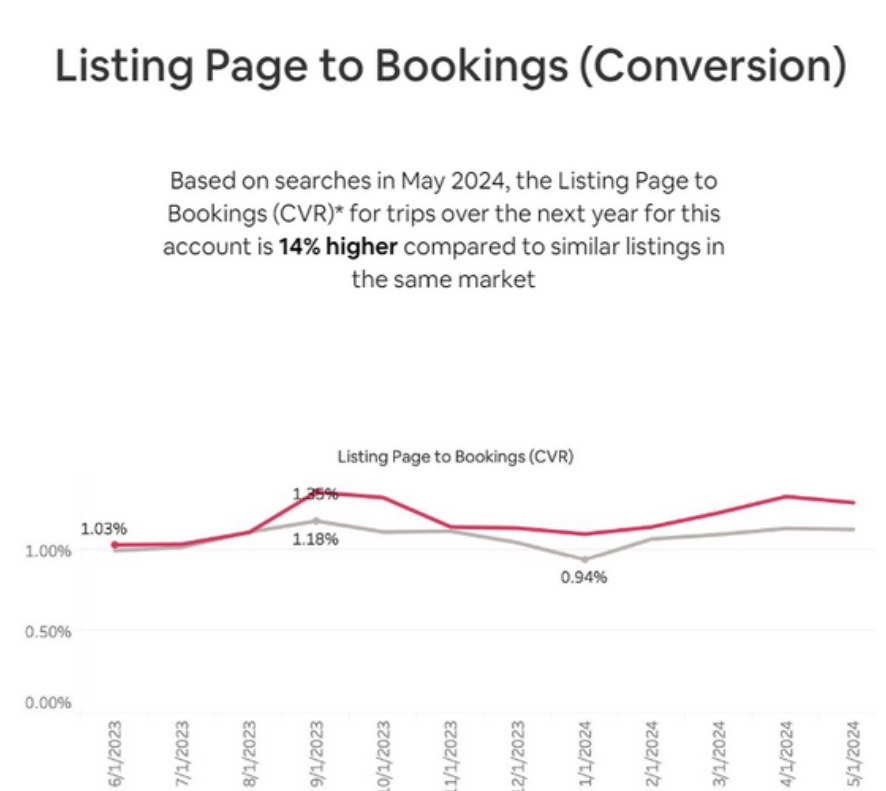
This upward trend, particularly notable from February to May 2024, reinforces the positive impact of process improvements we have made over that time. The sustained visibility and higher conversion rates translate into higher nightly rates and occupancy rates, ultimately producing more revenue. These results highlight our effective marketing strategies and commitment to excellence, positioning us well for continued success in the competitive vacation rental market.
Spotlight on RevPAN Trends: Maximizing Returns Through Seasonal Insights
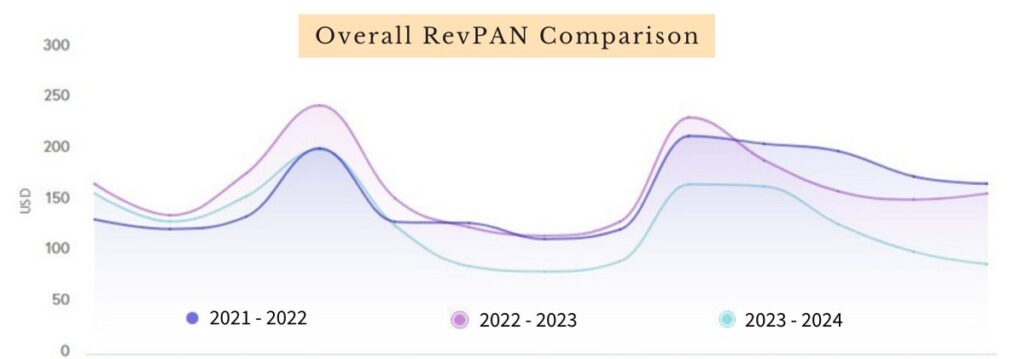
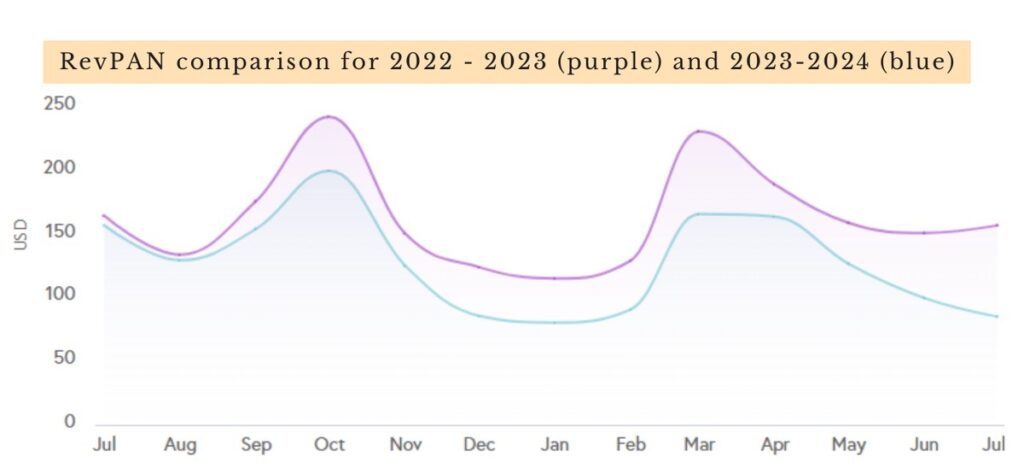
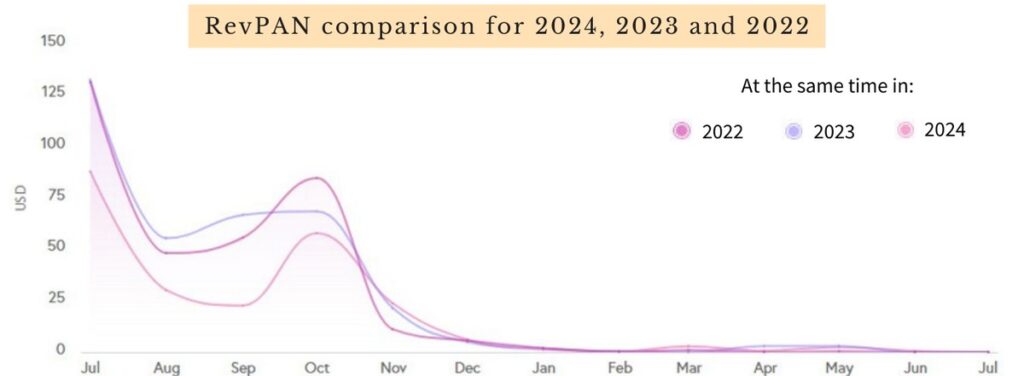
Revenue per available night (RevPAN) trends reveal some exciting patterns over the past years! October and March continue to shine with the highest revenue per available night, offering fantastic opportunities for property owners. While the summer months typically see a dip, this is a natural part of the seasonal rhythm in Austin.
Despite a slight decline in peak values year over year, 2024 brings promising news. Although early numbers were not as strong as the previous years, we’re thrilled to see a shift starting in November. This positive trend puts 2024 ahead of the last two years, hinting at the beginning of the end for the oversupply in the Austin vacation rental market.
Exploring Occupancy: Year-Round Stability and Seasonal Peaks
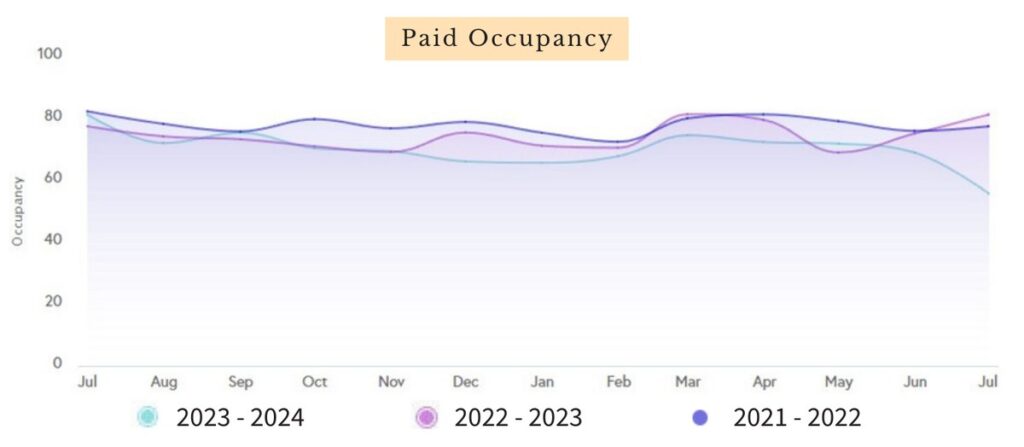
Paid occupancy rates show consistent stability, hovering between 66% and 80% year-round. Despite a slight decline in overall year-over-year occupancy rates, we are thrilled to report that our occupancy is substantially higher than the Austin market average. Note that since this data was pulled in early July 2024, the occupancy for that month doesn’t reflect the final month occupancy.
Stellar Forward Occupancy Rates: Outperforming the Market by 39%
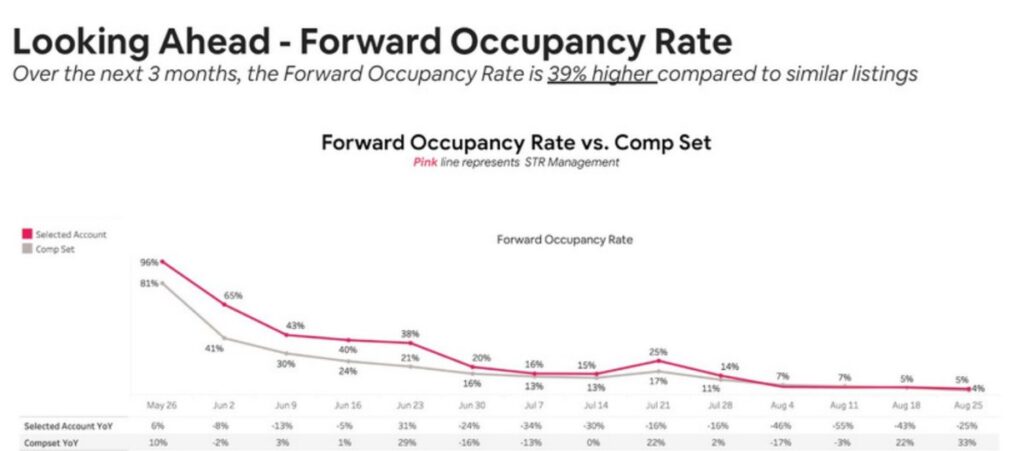
Our forward occupancy rate data from May 26 to August 25 reveals a stellar performance, with our listings projected to achieve a 39% higher occupancy rate compared to similar listings in the same market. This demonstrates our market strength and effective management strategies. The pink line below represents our account, starting at a robust 96% occupancy on May 26, well above the market average of 81%. While occupancy rates naturally decline looking into the future, our listings consistently outperform the competition. For instance, on June 2, our occupancy rate was 65%, compared to the market’s 41% as of May 26.
Questions about how your home is performing? Contact STR Management, or browse all of our Austin market reports.